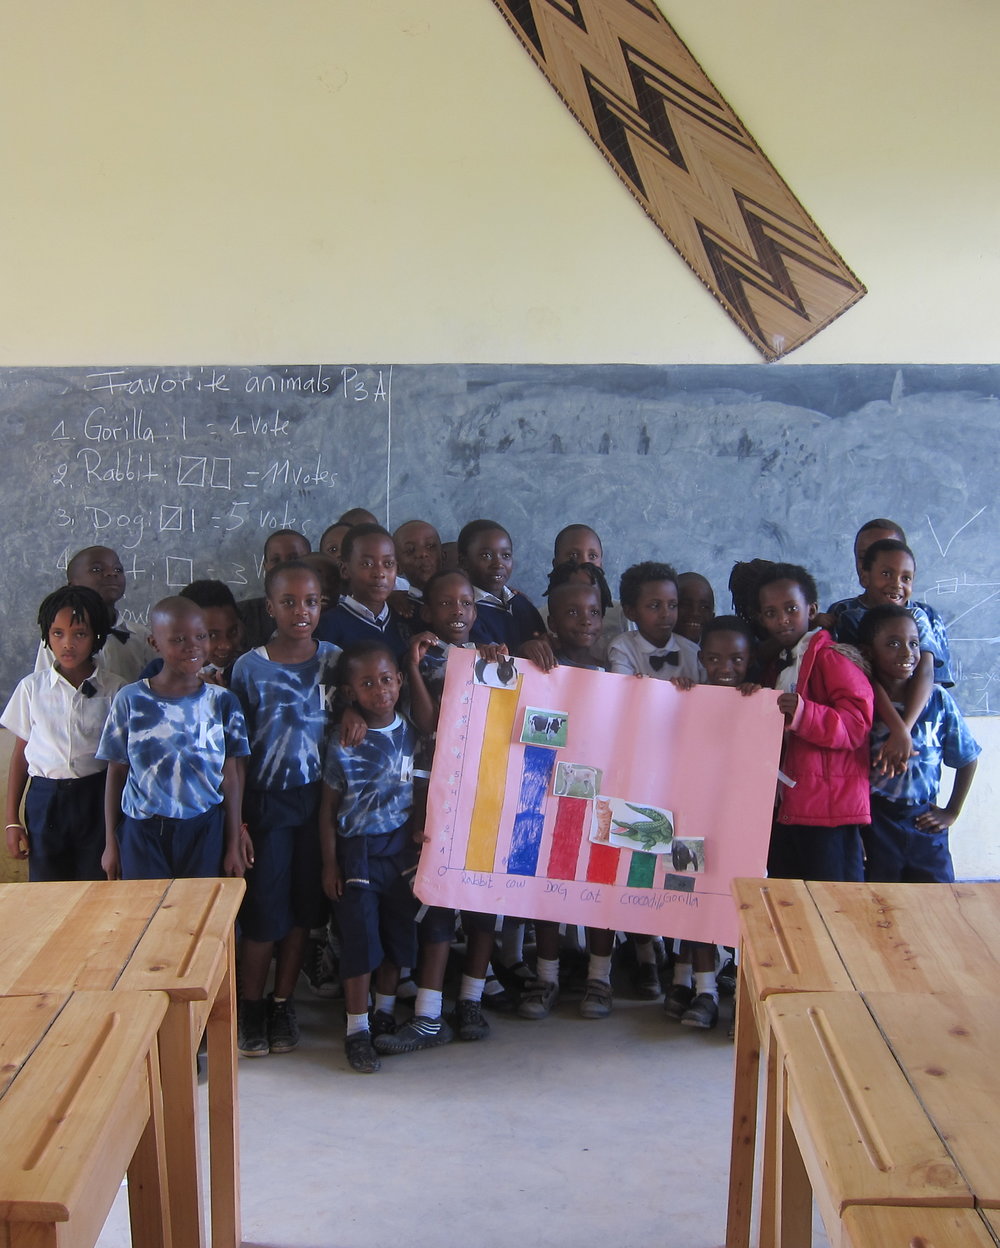
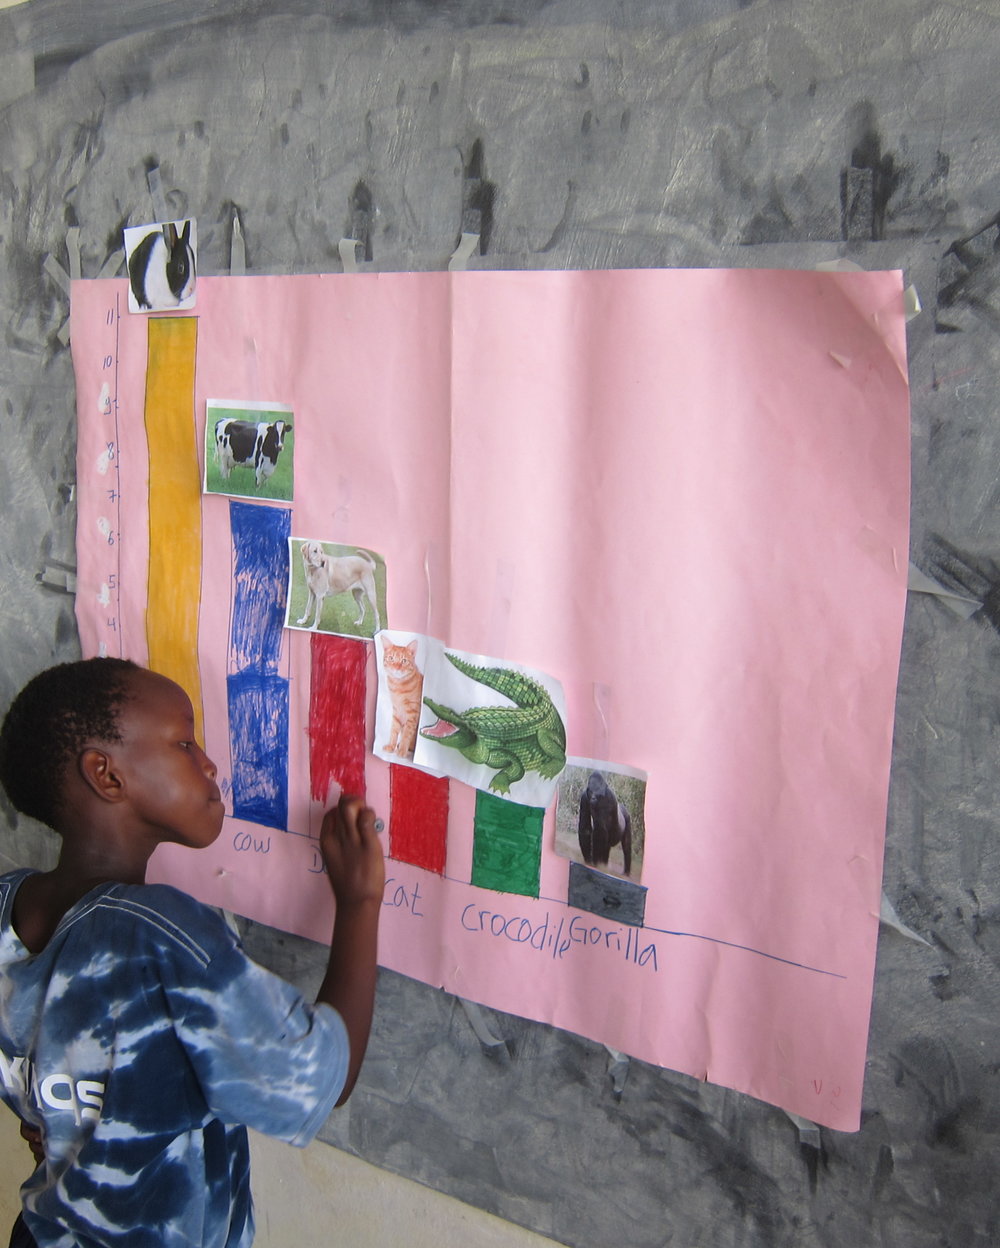
 Children love big sheets of paper and color. So 3 classrooms began projects making graphs. Two made a bar graph and one a line graph. The process of data gathering included making choices by voting on favorite animals and foods. Then they discussed how to use their data to make the bar graph. The line graph was on height. Students took turns measuring classmates then recorded their results. The graph from the US was in feet and inches. Urukundo students used centimeters but also noted feet and inches. Head teacher Irene was very involved and led a discussion about what each graph depicted and what they learned.